
Are we poised to relive the economic malaise of the 1970s and early-1980s?
Inflation emerged as the primary concern for the markets during the second quarter. The Consumer Price Index (CPI) reached 8.6% in May, putting to rest any remaining hope that the inflationary pressures of the past year were “transitory.” While there are parallels to the stagflation of the 1970s and early-1980s, a closer review gives us confidence that the risk of a stagflation redux today is low. It has been remarkable how quickly the fear of stagflation has risen. The chart below from Bloomberg’s chief economist shows news stories mentioning “stagflation” have dominated the news cycle as inflation has continued to climb.

In this article, we will compare the current environment with the 1970s and 1980s. We’ll discuss what we see as the likely path of inflation over the balance of the year and beyond, including some of the risks that could keep it elevated. Then we’ll conclude by reviewing how multi-asset class investing helps position your portfolio for inflationary environments.
Stagflation is the combination of high inflation, the belief by consumers and markets that inflation will remain high, and stagnating economic activity. While concerns about the economy entering stagflation are understandable, today’s inflationary environment is much different than in the 1970s and 1980s. Back then, inflation began to increase in the mid-1960s and remained elevated for nearly two decades. The Fed allowed inflation to run hot during this period because it prioritized full employment. Monetary policy at the time believed that high inflation was the cost of, and a reasonable trade-off for, full employment.
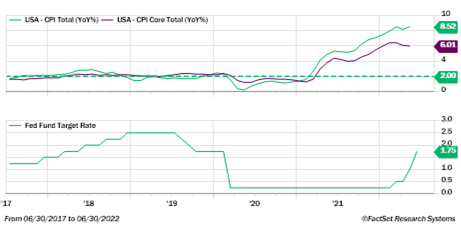
By the time Paul Volcker became Fed Chairman in August 1979 (black dotted line on the following chart), CPI had averaged ~7% over the prior decade, stagflation had taken hold, and inflation was out of control. Crucially, a decade of elevated inflation meant that consumer expectations for future inflation were equally high. This dynamic helped to create a self-fulfilling inflationary spiral which saw inflation peak at over 14% in early 1980. It took Chairman Volcker increasing short-term rates to 20% to break this pernicious cycle and regain control of inflation.

Today, inflation only reached concerning levels in the second half of last year. Since the early 1990s, inflation has been consistently around the Fed’s 2% annual target. Last September, Core CPI was just 4%, and today it’s just over 6%. Since inflation became a concern, the Fed, in contrast to the 1970s, has responded quickly by embarking on the fastest tightening cycle in recent memory. Chairman Powell recently said that the failure to restore price stability (i.e., reduce inflation) is the largest current economic risk. The Fed is committed to controlling inflation and ensuring that consumer and market expectations for future inflation remain around 2%, thus avoiding the high inflation expectation feedback loop that occurred in the 1970s.
Inflation expectations are tracked through consumer surveys and market implied expectations. Recent surveys have shown that consumers expect inflation to remain elevated over the next year; however, over the next 3 to 5 years consumers see inflation in the 3% to 4% range – higher than their long-term expectations were a year ago, but not anywhere close to stagflationary levels. The Fed has indicated that these surveys influence its policy response and is acutely focused on keeping consumer inflation expectations in check.
Breakeven inflation rates are the market-based expectation of future inflation and are another key indicator the Fed monitors. Breakeven inflation rates for the next 5 and 10 years are down from multi-decade highs earlier this year and now at the lowest levels of the year so far, and in line with longer-term averages.1 Declining breakeven inflation rates support the belief that the Fed has the wherewithal and credibility to control long-term inflation.

Looking ahead, we expect inflation to peak during the second half of the year at levels potentially above 9%. We see housing and energy prices continuing to exert upward pressure on prices during the balance of the year. While in 2023, we see several forces contributing to downward price pressure, including the effects of the Fed’s interest rate increases, the lapping of elevated inflation readings from late 2021 and 2022, mean reversion in several CPI categories, and easing supply chain constraints.
Elevated energy prices will continue to keep headline CPI elevated in the near-term. However, as the energy market rebalances and we lap the high energy prices of 2022 next year, we expect energy’s upward pressure on CPI will begin to abate. In fact, at the time of this writing, the price-per-barrel of crude oil has already fallen nearly 20% from March highs. Housing, which accounts for about 40% of core-CPI, will likely continue to climb since the method used to calculate housing costs generally lags house prices and has not fully reflected the recent appreciation in housing prices. However, upward pressure from housing is expected to dissipate next year as the current cooldown in house prices is fully incorporated into CPI.
During the second half of the year, CPI readings will begin to lap the elevated inflation readings from the middle of last year, including the 0.9% month-over-month reading in June 2021. The previous few CPI reports have compared current prices to prices before inflation started to pick up, helping to lead to higher headline and core readings. As the year progresses, year-over-year CPI readings will be compared to the higher prices seen in the second half of 2021, helping to lower the year-over-year growth calculation. Additionally, numerous critical components of CPI are seeing unsustainably high year-over-year growth that will eventually revert to historical averages, including airfare +38%, health insurance +14%, lodging +20%, new autos +12%, used autos +16%, and furniture +13%. We expect these forces to result in steadily declining CPI throughout 2023.
A core tenet of multi-asset class investing is having exposure to various asset classes to position your portfolio for a wide range of market outcomes. The value of such a strategy has paid off in the first half of the year. Leading up to the current inflation scare, we maintained an allocation to Natural Resources, and energy equities in part as an inflation hedge. These allocations had been a drag on portfolio performance. However, this year the outsized gains by these positions have been a bright spot in an otherwise disappointing market environment. The investment team at Osborne Partners manages your portfolios by staying true to our multi-asset class discipline and continuously looking to improve our positioning to prepare it for a wide range of market outcomes.
1 A breakeven inflation rate is calculated by subtracting the yield on a Treasury Inflation-Protected Securities (TIPS) bond from the yield on a nominal Treasury bond of the same maturity. The principal amount of a TIPS bond increases with inflation. Since inflation is the only difference in risk between TIPS and nominal Treasuries, the difference between their yields equates to the market’s expectations of inflation.