
Financial markets are influenced by a wide range of factors. War, elections, technological shifts and interest rates tend to grab most of the headlines, and for good reasons. One factor that has received more coverage of late, and that we expect will only draw more attention, is the weather or, specifically, El Niño. El Niño is a periodic warming of the Pacific Ocean that sends ripples through weather patterns around the globe. And while that may sound somewhat innocuous, in past episodes we have seen it inflict meaningful damage via floods, droughts and broader economic disruption. Early warnings from climate scientists suggest this year’s El Niño is shaping up to be one of the larger events on record. In its September update, the National Oceanic and Atmospheric Administration (NOAA) put the odds of a “very strong” El Niño this fall and winter at greater than 90%, and the odds of a historic event – stronger than any El Niño on record dating back to
1950 – at 75%. In this article, we’ll look at what El Niño is, how markets have behaved during past episodes and what may be in store over the next several months.
El Niño 101
El Niño is a warming of the ocean surface in the central and eastern tropical Pacific. The NOAA declares El Niño conditions when the Oceanic Niño Index (ONI) or, sea surface temperatures in a key stretch of the Pacific, run 0.5° C or more above average. What causes it? Normally, trade winds blow west along the equator, pushing warm surface water toward Asia. During El Niño, those winds weaken, warm water drifts back east toward the Americas and the warmer water weakens the winds even further, causing somewhat of a self-reinforcing loop. Episodes arrive every two to seven years on average, typically last nine to 12 months, and tend to peak between November and February.
Despite using water temperature in the Pacific as a key determinant, the impacts are felt around the world. Across the U.S., the jet stream shifts south: the southern half of the U.S. from California to the Carolinas tends to be cooler and wetter, while the northern U.S. tends to be warmer and drier, often meaning lower winter heating bills. Outside of the U.S., rainfall tends to decline over Indonesia and western Pacific, India typically sees a weaker monsoon season, and Atlantic hurricane activity is typically suppressed. Importantly, these impacts are probabilities, not certainties, although the current event is already well underway. Water temperatures are running 1.8°C above average in August, well above the 0.5° bar for El Niño, and NOAA expects further strengthening through year-end.
What History Tells Us
If El Niño is here and appears to be a more severe episode, what are the implications for financial markets? To help us get answers, we looked back over the past 30 years at the nine El Niño events that took place during that time span to gather some insights into what may be in store for us. For this analysis, we focused on the three asset classes that tend to see the largest direct impact: U.S. equities, foreign equities and commodities.
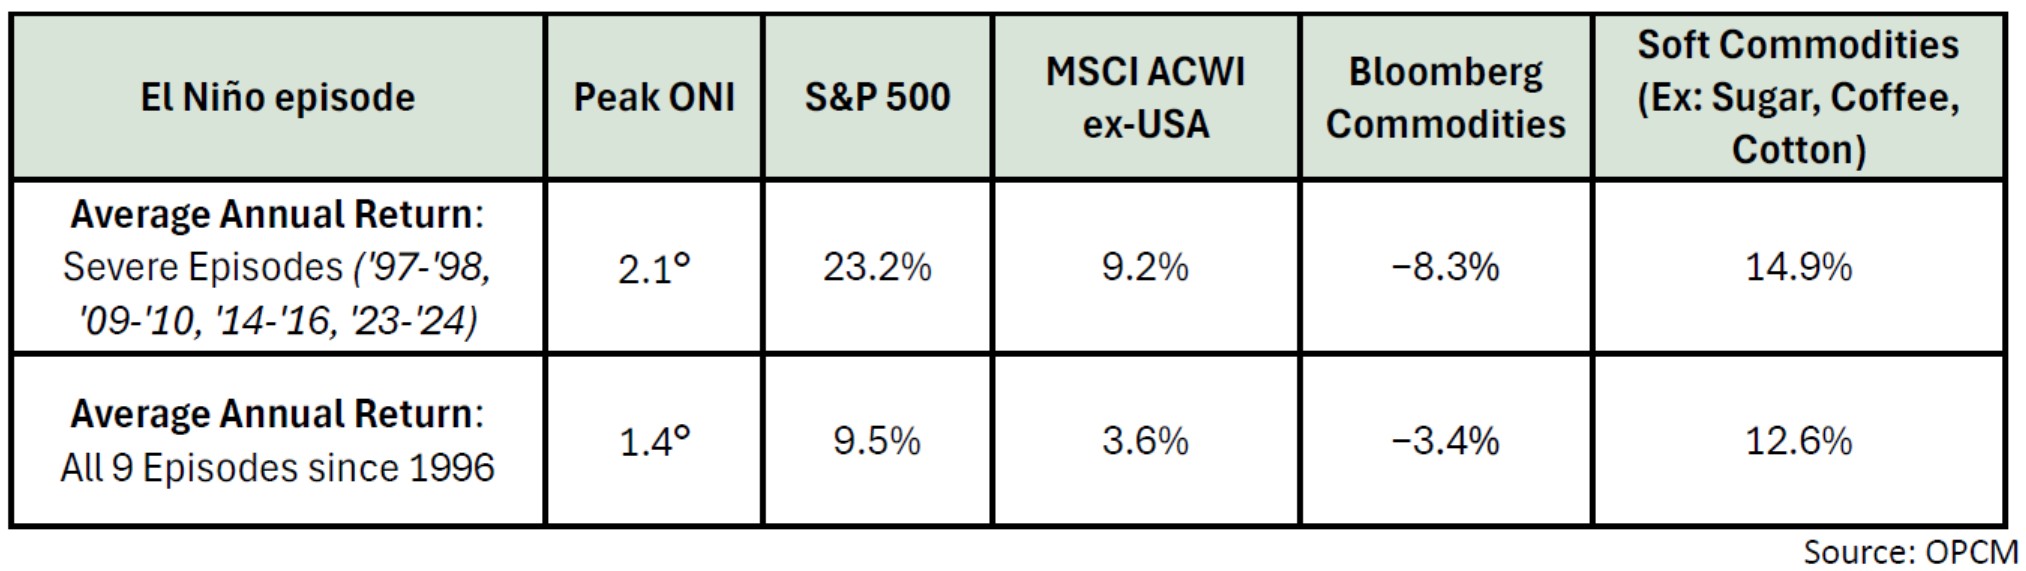
On average, U.S. equities rose 9.5% during El Niño episodes, foreign equities (MSCI ACWI Ex-U.S.) gained 3.6% and commodities (Bloomberg Commodity Index) slipped 3.4%. Interestingly, U.S. equities did best during severe episodes, averaging +23.2%. Before reading too much into that, it’s worth acknowledging what else was going on behind the scenes. The 1997–98 episode coincided with the late–1990s bull market,
2009–10 with the recovery from the financial crisis and 2023–24 with an AI-fueled rally. Weaker episodes, meanwhile, include the 2002 bear market and the COVID-19 selloff. In other words, the broader market backdrop has occasionally mattered more than the weather.
That said, a few patterns have been consistent. Within U.S. equities, the Information Technology sector was the most consistent winner, outperforming in seven of nine periods. Consumer Discretionary stocks have also performed well, outpacing the S&P 500 by over 4% on average across all El Niño events. Somewhat counterintuitively, defensive sectors such as Consumer Staples and Utilities lagged during severe episodes, which largely took place in rising markets. The Energy sector has been the worst performing sector on average, lagging the S&P 500 in seven of nine episodes, by an average of 9.6% (13.8% in severe episodes) and is the only sector with negative average overall returns.
Commodities: Beneath the Surface
Commodities have been a mixed bag during El Niño. Within the energy complex, Oil has tended to perform poorly, averaging returns of roughly -8% since the late 1990’s. Natural Gas has fared better, averaging returns of just under 10%, although it has delivered negative returns in each of the last four periods and has averaged -12.5% returns during severe episodes. While dynamic weather conditions caused by El Niño have hurt some commodities, others have benefited. Soft commodities, the most directly exposed to shifting weather in growing regions, have held up remarkably well. Coffee and Cocoa each rose in seven of nine episodes, with median gains of 16.1% and 13.9%, respectively. Cotton, too, has performed well in severe episodes, up 9.1% on average. Cocoa’s 237% surge during 2023–24, amid poor harvests in West Africa, is the most extreme example. Overall, soft commodities have averaged just over 12.5% returns with that figure jumping to nearly 15% when homing in on the most severe episodes. Outside of soft commodities, Gold has also fared well; rising in eight of the nine episodes, averaging +9%, including 2019–20, when stocks, oil and the commodity index all fell sharply.
Weather-driven supply disruptions are notoriously difficult to predict, which is why we believe in maintaining exposure to alternative asset classes like commodities. Commodities often respond to drivers like weather, supply shocks, inflation and geopolitics, which have little to do with corporate earnings, providing a source of return that can behave differently than traditional stocks and bonds. Just as important, the dispersion across individual commodities during El Niño episodes creates opportunities for more nuanced positioning within the asset class.
Staying Ahead of the Weather
Part of managing risk is staying abreast of wide-ranging factors and assessing how they may impact financial markets, even something as seemingly distant as ocean temperatures in the Pacific. History suggests El Niño alone has rarely dictated the direction of markets, but it can meaningfully influence various components across asset classes. With a potentially historic event upcoming, we’ll be watching closely for effects on our portfolio over the next several months. Regardless of how severe this El Niño ends up being, our multi-asset class portfolios are well-positioned to be resilient across a wide range of conditions.
