
When the technology sector peaked at an astounding 35% of the S&P 500 index during the 2000 dot-com bubble, before subsequently plunging over 80%, many believed we would never witness that level of market concentration again. Today, history is not only repeating itself, it is being rewritten. A true look at the S&P 500 reveals that “technology” now commands an awe inspiring 55% of the index.
On paper, the official Information Technology sector comprises 40% of the S&P 500, which is the U.S. equities primary benchmark. However, these reported sector weights materially understate the actual index concentration to a single theme. The official numbers exclude several massive companies that investors universally treat as tech businesses. Following a 2018 reclassification by S&P Dow Jones Indices, tech giants like Alphabet and Meta were moved into Communication Services, while e-commerce and tech leaders like Amazon and Tesla remain classified under Consumer Discretionary. When adjusted for these hidden tech heavyweights, the index concentration becomes unprecedented.
Restoring these constituents to the technology total, the composition of the index appears as follows:
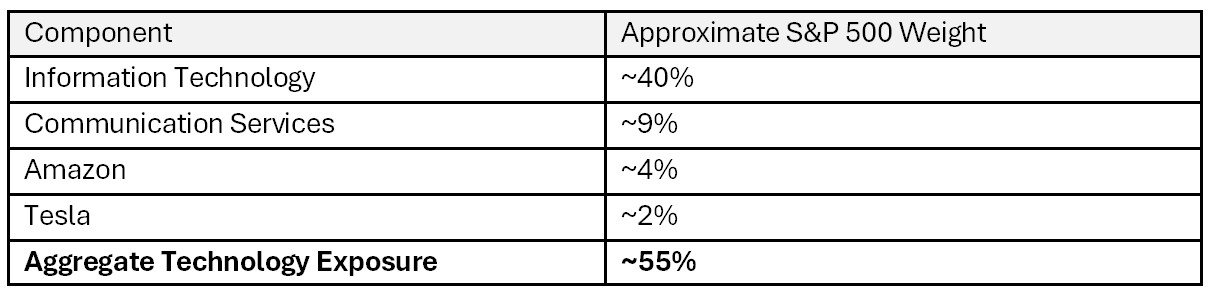
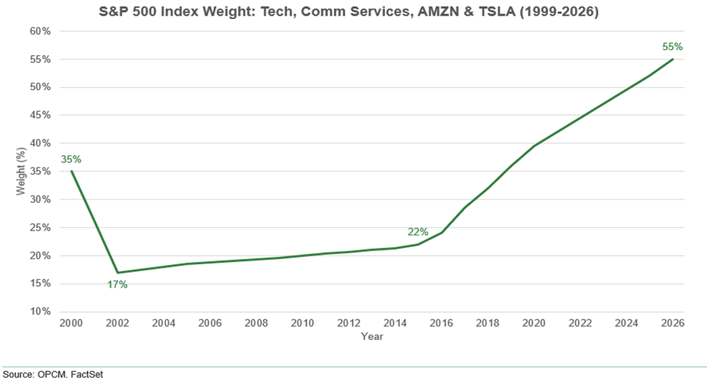
Current technology exposure at 55% is therefore approximately one and one-half times the level recorded at the peak of the most widely studied speculative episode in U.S. equity market history. The following is a chart from the end of 1999 to today, showing “technology” as a percent of the S&P 500 index.
Historical Context
Technology accounted for approximately 7% of the S&P 500 in 1990. Its weight rose to roughly 35% of the index by early 2000 and subsequently declined to the mid-teens by 2002 as the bubble popped. The present cycle commenced in 2009 and has persisted for more than fifteen years with some vicious bear markets in between. Furthermore, as of the end of July 2026, the ten largest constituents accounted for 40% of the S&P 500, well exceeding the 26% concentration observed in March 2000.
As investors learned from the aftermath of the speculation, the post-bubble losses incurred were so substantial that it took nearly 26 years to regain the losses felt in essentially two years. The 26-year chart below depicts this phenomenon.
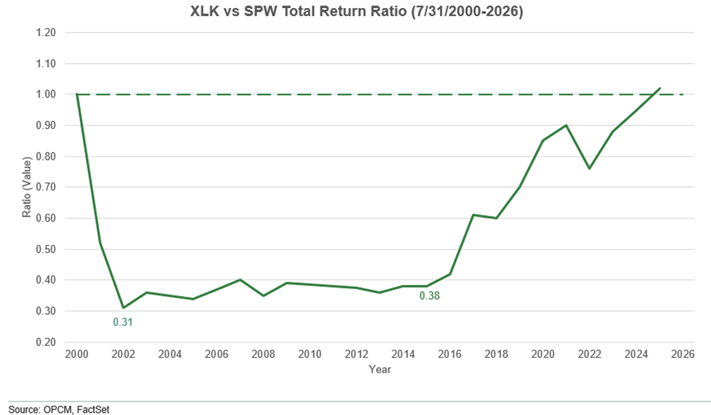
What are the risks of an even more extreme concentration as we see today? Although there are many, we see three principal risks.
- The S&P 500 no longer offers meaningful diversification. Investors allocating to the broad market reasonably expect exposure to 500 companies across eleven sectors. In practice, more than half of each dollar invested is directed toward a single theme. The rolling twelve-month correlation between the S&P 500 and the Nasdaq-100 reached an all-time high of 0.98 earlier this year. Under current weights, a 30% decline in technology shares alone would reduce the index by approximately 17 percentage points, before accounting for any spillover into the remaining 45% of the index.
- The exposure is further concentrated in a single capital expenditure cycle rather than merely a single sector. In 2000, the technology sector comprised personal computers, telecommunications equipment, enterprise software, and early internet businesses, each with distinct end markets. Today, the largest index weights are linked through a common artificial intelligence infrastructure build-out, and these companies are, to a significant degree, one another’s customers. The capital expenditures of Microsoft, Alphabet, Amazon, and Meta constitute the revenue of Nvidia, Broadcom, and the leading memory and networking suppliers. When hyperscaler spending decelerates, suppliers will experience slowing growth at the same time that purchasers face heightened scrutiny of their returns on invested capital. The diversification within the 55% is consequently narrower than headline figures suggest.
- Extreme sector concentration has historically reverted, and reversion from elevated levels has coincided with extended periods of weak returns. The Energy sector reached nearly 28% of the S&P 500 in 1980 and declined in relative weight over the following 30 years. Technology reached approximately 35% of the index in 2000 and was halved within roughly two years. Passive investment flows reinforce this situation: capitalization-weighted indexing directs a growing portion of each new dollar toward securities that have already appreciated, and the same problem operates in reverse during periods of net redemptions.
Valuation: Technology on an Enterprise Value-to-Sales Basis
Revenue-based multiples provide the most consistent basis for comparison across market cycles, as they do not depend on the assumption that current record high margins are sustainable. The S&P 500 EV/S ratio on 2027 sales stands at over 3.7x, a record, and well above the roughly 3.2x recorded at the 2000 peak.
The common counterargument revolves around profitability. Today, leading technology companies are more profitable than their 2000 predecessors, and on an earnings basis the sector appears less expensive than 2000, when S&P 500 technology traded at 50x earnings. This observation has some merit; however, it carries a corresponding risk. A multiple of over 7.5x sales is justified only if current record margins prove durable. Any normalization, whether coming from competition, pricing pressure in artificial intelligence services, or depreciation associated with the current capital expenditure cycle, would negatively affect earnings and valuation multiples at the same time.
The Equal-Weighted Index: Historical and Current Valuation
On the flipside to the high concentration and peak valuation in technology is the median constituent in the S&P 500 is not expensively valued. The S&P 500 Equal Weight Index currently trades at a forward price-to-earnings multiple of only 15x, below the long-term average, and well below the 19x for the capitalization-weighted index. This discount of over 20% compares with an average of roughly 1% since 2010 and represents the widest gap in decades. Recently, the three-year outperformance of the capitalization-weighted index relative to the equal-weighted index exceeded the high margin recorded at the peak of the internet bubble era.
The most relevant precedent is 2000, when the equal-weighted index traded at a similarly pronounced discount to the very technology-heavy, capitalization-weighted benchmark.
Forward Returns from Current Valuations
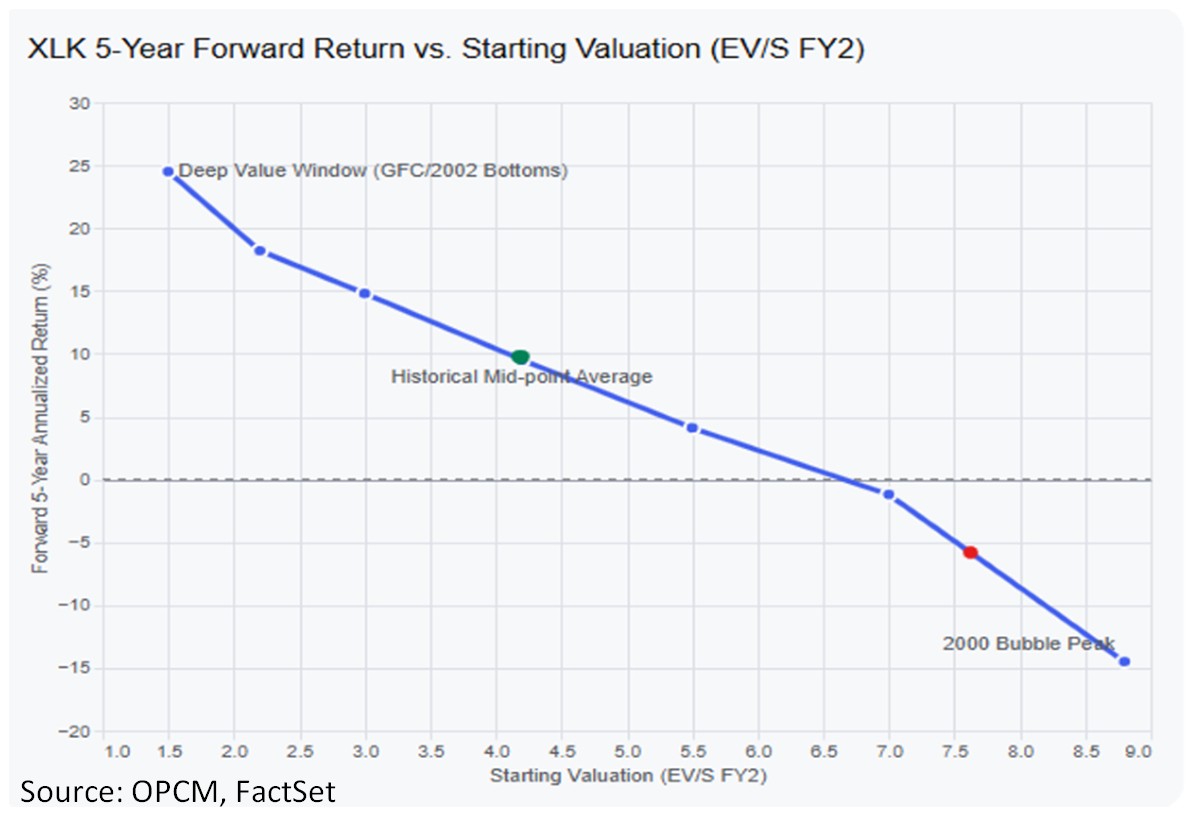
From its March 2000 peak, the S&P 500 Information Technology sector declined over 80% through October 2002 and required the better part of 26 years to recover its prior high. That decline originated from an EV/Sales multiple of over 8.5x. The current starting point is similar with the index concentration higher. Historically, we are unable to find an instance in which a sector entering at comparable valuation and index weight subsequently delivered strong 5 to 10-year returns.
As shown below, historically, the technology sector trades just above 4x EV/S on average and delivers a 10% annual return. The more valuation slides to the left (cheaper), the higher the historic 5-year forward return. For example, an investor who buys the technology sector below 2x EV/S has earned an incredible 20% annual return. However, the opposite occurs when valuation slides to the right (more expensive). For example, at today’s valuation (red dot) an investor can expect to earn a negative 5% annual forward return – terrible.
Equal weight (RSP). In the decade following the 2000 peak, the equal-weighted index generated a cumulative total return of approximately 65%, while the capitalization-weighted S&P 500 fell 10%. That is a 75% return difference. A similar pattern followed the Nifty Fifty era: from 1974 through 1983, the equal-weighted index outperformed the market-cap weighted S&P 500 by 240%. Historically, the widest periods of capitalization-weighted outperformance have been followed by approximately five years of equal-weighted outperformance. Many clients are shocked when we mention that over the long term, the equal-weighted index (RSP) has outperformed its capitalization-weighted counterpart (SPX) by approximately 120 basis points annually since 1971.
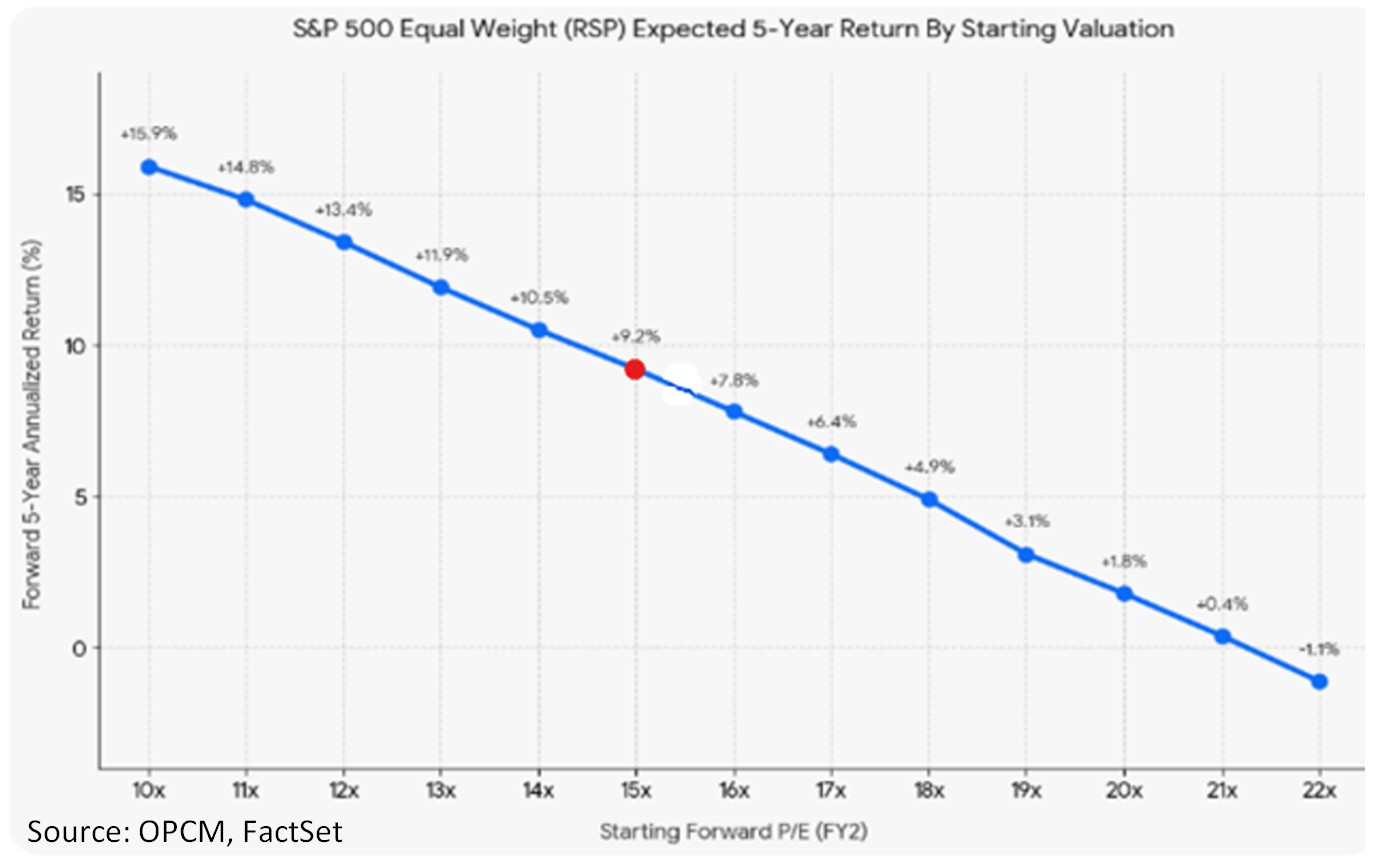
As shown in the following chart, according to history, the equal-weighted S&P 500 is expected to return over 9% annually. We would hypothesize that companies with stronger than average fundamentals and solid balance sheets trading at high return-to-risk ratios (RRR) could surpass this return profile.
This analysis does not suggest that artificial intelligence lacks economic substance or that it will not change the world. The internet was a genuine and transformative technology in 2000, yet the stocks fell over 80%. 26 years later we cannot live without the internet. The difficulty lies in valuation, concentration, and euphoria.
At present, approximately 55% of the S&P 500 is concentrated in a single theme, and that theme trades at a near record valuation, while the remainder of the market trades at a historically wide discount. This asymmetry is what supported our recent reduction in technology, especially cyclical semiconductors, in favor of nearly any other investment with a high probability of future outperformance. In July, we witnessed a “mild episode” of what happens when this phenomenon unwinds. In the recent tame example, AI-related companies fell 25% or more in a matter of one month (about 22 trading days).
