
A shift in focus may be upon us in U.S. equities.
Investors had a lengthy list of worries in the first three quarters of 2022, starting with the omnipresent war in Ukraine and its impact on energy markets. Then three other main worries took the stage. Overseas, China’s zero COVID policy has pushed its economy to the brink of prolonged economic slowdown threatening global growth. Meanwhile in the U.S., investors are faced with the dual threats of multi-decade high inflation and a Federal Reserve that is increasing short-term interest rates at a record clip.
As we have written about previously, the initial outcome of the dual threats of high inflation and Fed tightening was the implosion of smaller asset bubbles like Crypto, SPACs, Cannabis, and IPOs. Additionally, high-growth/high-valuation stocks saw their prices fall 50% to 90%. Now the damage has spread into higher quality equities and other asset classes. This year is shaping up to be one of the worst years for markets in history, with only 2008 standing out as potentially worse – though bonds gained 3% in 2008.
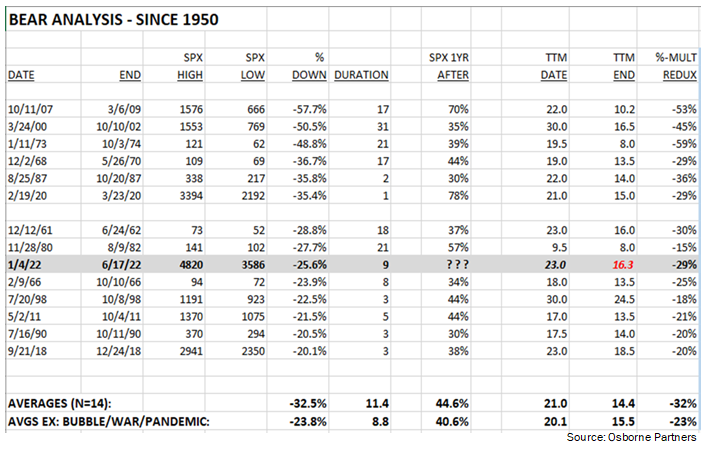
The present bear market in U.S. equities is now the ninth worst since 1950. As shown in the following table, compared to the average of all 14 bear markets since 1950, today’s decline of 25.6%, 9 month duration, and 29% valuation contraction (trailing P/E multiple) are near the averages for prior bear markets. While market bottoms are difficult to call, the recent low places today’s bear market at a fairly mature level.
Foreign equities have not fared much better in the face of U.S. interest rate increases. Additionally, the U.S. Dollar has experienced nearly unprecedented strength this year, placing further pressure on foreign equities. As a result, foreign equities (MSCI ACWI ex US) have fallen over 26% in 2022. It is interesting that these brutal equity market returns in 2022 have actually been overshadowed by the real estate asset class (NAREIT Global Index) which fell nearly 30% so far in 2022 due to rising interest rates and a slowing economy.
However, the largest shock for investors has been the double-digit decline in the fixed income asset class. Before 2022, the worst year for bonds in the past 50 years was a 3% decline in 1994. Through the first three quarters of 2022, the largest bond market index, the Bloomberg Aggregate Bond Index, is down 14% (fourteen!). This means the average “diversified” investor in a 60% Stocks and 40% Bonds portfolio, who is used to gaining 4-6% per year, has lost 20% in 2022 as both stocks and bonds have declined in unison.
Your Osborne Partners portfolio includes three more asset classes that have fared better. All three of these asset classes have posted positive returns in 2022: natural resources (an inflation hedge), alternative investments (largely our portfolio hedges), and cash (of which our exposure throughout 2022 has been well above average).
With all the worries, panic, and negative returns in 2022, let us review the worries investors have focused on, while introducing our thesis that investors will soon shift to focusing on one area more than others.
First, China’s zero tolerance COVID policy has led to major volatility in their markets and variability in their economy. First, the Chinese economy is closing in on the worst levels of GDP growth in over two decades – excluding the brief pandemic-induced economic dive. Real GDP growth is nearing 0%.

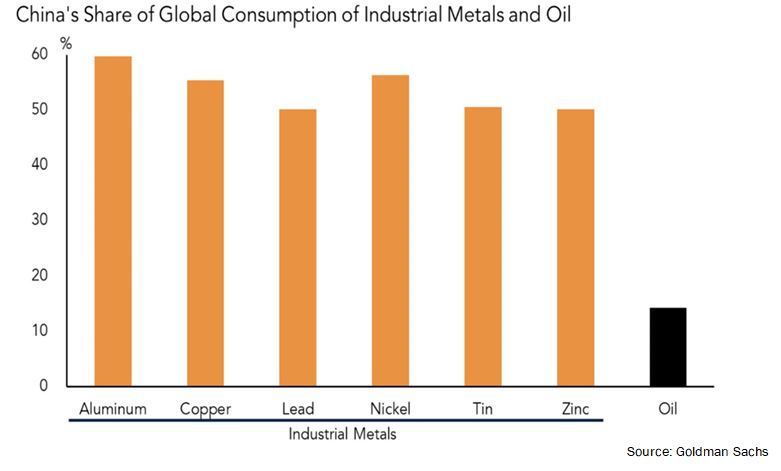
A slowdown in China is important because not only is China’s consumer an extremely important part of the global economic engine, but China is the most important trade partner for many countries, and the largest consumer of industrial metals as shown in the following chart.
There are indications that China is beginning to loosen their COVID restrictions, just as the government is stimulating the economy. Investors are beginning to react in a more benign way to each negative announcement with Chinese equities seemingly falling less on bad news arguably since March. We believe the investor focus will slowly shift away from China over time.
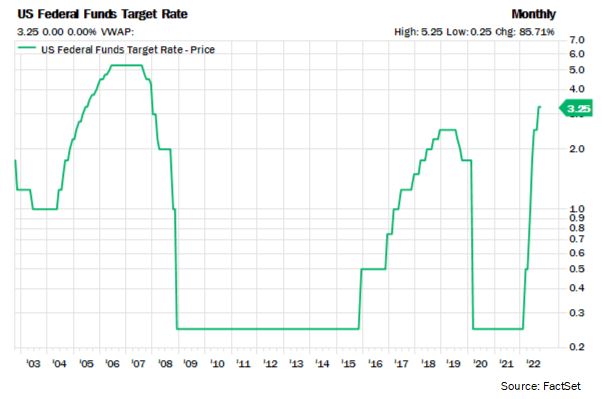
The second major worry for investors has been interest rates, both in the size of the increases and the duration. From the very short end of maturities, the Fed Funds rates was tethered at essentially 0% for nine of the past thirteen years. However, in the face of high inflation, the Federal Reserve has increased short-term interest rates at a furious pace, with the target rate now sitting at 3.25%.
Higher interest rates are headwinds for everything from buying a home, to buying an automobile, to sourcing a personal loan, to credit card interest rates, to importantly equity valuations. If an investor is faced with the choice of investing in a higher-risk asset class like equities with a P/E of 25x or lower-risk bonds with a yield near 0%, the choice is easy. But this choice is more difficult when the lower-risk investment pays 5% annually. If this is the case, equity valuations have to fall to make the asset class intriguing on a relative basis.
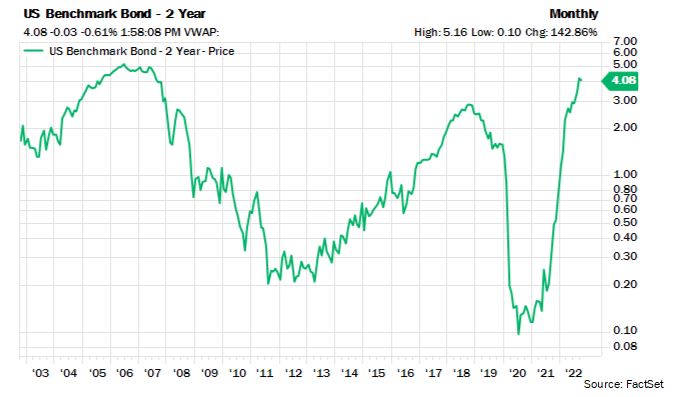
Investors continue to attempt to pinpoint when the Fed will stop raising rates, and at what interest rate they will stop. If equities are priced at a P/E of 16x, is that enough to compensate for a Fed Funds rate at 3.25%? Most likely yes. But what if the Fed increases the Fed Funds rate to 5% over time? Then a P/E of 16x may not be enough for investors to assume more risk. The following chart shows the twenty-year history of the two-year U.S. Treasury Note, which presently yields over 4%. The yield morphed from literal irrelevancy to becoming a reasonable low risk alternative to equities and other risk asset classes.
This next table shows the market-implied probabilities of different Fed Funds levels at the future Fed meetings – probabilities are as of the end of the third quarter. Although these probabilities change over time, the table generally points to 4.50% to 4.75% as the terminal high rate which could be achieved in the next 3-4 meetings.

It is our belief that as we approach the terminal rate, investors will begin to anticipate a change in Fed policy towards easing. We see emerging signs of investors starting to anticipate easing now as we are at least two-thirds of the way to reaching the Fed’s current estimated terminal rate. As time passes, interest rates will likely be less of a focus for investors as markets will have fully priced in the tightening cycle in various asset classes.
Finally, the largest worry of 2022 has been inflation, which spiked to levels last seen four decades ago. As various inflation measures from CPI to PPI to PCE spiked in 2022, investors quickly pivoted from the previous consensus of inflation being transitory to believing that it would actually last many years. The result would be a loss of purchasing power for consumers and a reduction in margins and earnings for companies.
These fears culminated in the spring as the five-year breakeven inflation rate reached 3.6%, basically saying inflation would continue to be well above average for the next five years. However, as inflation peaked in early summer, the breakeven inflation rate peaked as well. Now, the five-year breakeven inflation rate is nearly 2% – right at the long-term Fed target. This is the same level as four full years ago.

The same phenomenon can be seen in the ten-year breakeven inflation rate, now unchanged from four years ago.

Over the next few months, as the lagging components in inflation indicators catch up to reality, inflation should fall further, pointing to a cycle of normalization. A main lagging indicator is Owner’s Equivalent Rent, which tends to lag by 3-4 months. As inflation starts the normalization process, investors will shift their focus away from what has been the dominant worry of 2022.
As worries about inflation, interest rates, and China dissipate, where will investors focus their attention? We expect the answer will be valuations and specifically the P/E multiple. While the P/E has now compressed from 23x to just over 16x, a drop of nearly 30%, earnings estimates for 2023 have only fallen about 6% to $240 per share. Unless the economy weakens substantially from here, leading to further earnings estimate cuts, a P/E in the range of 15-16x is reasonable on an absolute, relative, and interest-rate adjusted basis.
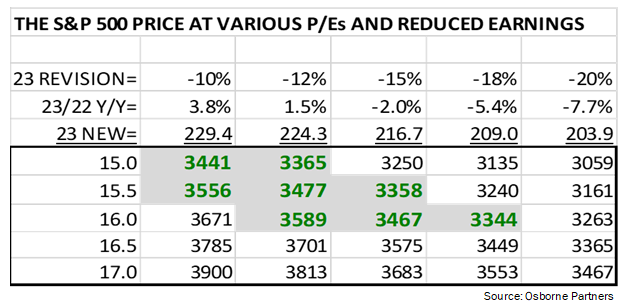
We believe investors should focus more on the growth trend of earnings in the quarters ahead to gauge the risk-to-reward ratio for equities. The following table compares different S&P 500 P/E multiples in the left column versus various earnings per share levels across the top. The table shows negative earnings revisions ranging from -10% to -20% from consensus earlier in the year. These revisions equate to 2023 earnings of about $230 to $204 per share versus consensus of $240 today. The shaded and green bold areas are where we presently peg downside risk. Interestingly, the S&P 500 actually entered the shaded/bolded area on the last day of the third quarter at 3,585 – or 15-15.5x P/E assuming earnings estimate reductions of 10-12%. At this point, from a risk-to-reward standpoint, the table would indicate the S&P 500 has less than 10% downside risk unless earnings fell at least 15% below the 2023 estimate in early 2022 and fell on a year-over-year basis.
The majority of our job as an Investment Team revolves around probabilities. Our job is to gauge the risk-to-reward ratio of each investment across all our asset classes. Although pinpointing actual market bottoms and tops is impossible, by using our RR (risk-to-reward) approach, we can discern the upside and more importantly, the likely downside of each investment. In domestic equities, as the S&P 500 enters the “grid” after a major bear market move, we are increasingly more comfortable reducing our cash level and investing into domestic equities and other asset classes with high RR’s.