
How has Osborne Partners’ asset-class positioning changed since the October 2022 lows?
Markets surprised the consensus view in the first half of 2023. Entering the year, the common view for 2023 sounded something like this – “The Federal Reserve will continue to raise short-term interest rates to fight stubbornly high inflation. High interest rates will buckle the consumer, while corporate earnings will post negative earnings growth throughout the year. This combination will cause equities to fall, leading to a recession and possible echo bear market in 2023.”
The result for the first half of the year was far different than expected. While the Fed raised short-term interest rates three more times, they have, at least temporarily, stopped at 5.25%, matching the 2006 cycle high. Inflation has fallen faster than expected, even with the headwind of stubbornly high housing costs. Contrary to expectations, the higher rates have not crushed the consumer as interest rate sensitive home and auto sales rebounded. Corporate earnings have been particularly resilient, as 2023 earnings expectations, which some market strategists predicted would fall 10% or more, could finish 2023 unchanged versus 2022.
We made several broad portfolio changes toward the end of the second quarter: transitioning from overweight most asset classes during the October 2022 lows, to a more defensive positioning today where we are underweight real estate and natural resources and neutral on domestic equities. In this piece, we will discuss some of our recent macro portfolio changes, along with our second-half outlook.
Our “Asset Class Stoplight”:

In domestic equities, the median S&P 500 company has gained approximately 5% year-to-date. Given the low median company return, it may be surprising to hear the S&P 500 Index as a whole was up nearly 17%. How was this S&P 500 return derived? Where are domestic equities valuations heading into the second half? Where are valuations compared to the rest of the world?
The overall return of the S&P 500 is simply the change in earnings plus the change in P/E multiple plus the dividend yield (earnings growth + multiple expansion + dividends). The chart below shows the year-to-date change in P/E, starting at 16.7x forward EPS and ending above 19x for an increase of 15%. With earnings growth hovering around 0%, the entire return of the S&P 500 was due to multiple expansion (over 15%) and dividends (about 1%).

The 50-year average P/E for the S&P 500 is approximately 16.3x. With the S&P 500 trading at 19.3x earnings or nearly 20% above the long-term average, does that mean domestic equities are overvalued and headed for another bear market?

While the S&P 500 appears expensive on the surface, appearances can be deceiving. High valuations in the largest companies are masking what are reasonable valuations for most companies. Below we show the S&P 500 valuation four different ways.
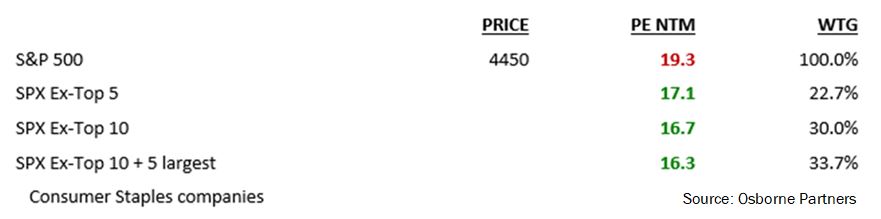
The entire S&P 500 (100% weight) trades at 19.3x. However, if you exclude the five largest companies (Apple, Microsoft, Alphabet, Amazon, and Nvidia) the valuation of the S&P 495 falls to a P/E of 17.1x. Next, if you exclude the ten largest companies, which comprise 30% of the index, the valuation of the S&P 490 falls further to 16.7x. Finally, if you exclude the top-ten plus the five largest consumer staples companies which investors, fearing a recession, have used as a hiding place, the remaining S&P 485 trades at a P/E of 16.3x – exactly at the long-term average.
Our average clients’ domestic equity exposure is underweight both the consumer staples sector and the mega-cap top-ten as a result of their elevated valuations. As the market has marched higher, our reward-to-risk ratios (RR’s) have steadily fallen. As a result, we have reduced both the number of holdings in domestic equities and our overall exposure in domestic equities to a more neutral positioning. At the time of this writing, the median RR for our domestic equities holdings is 1.0, meaning equal reward versus risk. This ratio was well over 2.0 in October 2022.
In the foreign equities asset class, there is a massive valuation discount relative to U.S. equities, providing a margin of safety that enables us to be slightly overweight the asset class. Not only are foreign equities trading at a 33% discount to the U.S. (U.S. 19.3x and ACWX 12.9x — see chart), but earnings growth has started to inflect positively prior to the U.S. earnings trough.

With earnings growth and valuations as potential tailwinds to foreign equities, where are we positioned from a country standpoint versus the benchmark?
Our Osborne Partners Country Weighting Stoplight:

On a country specific basis, we continue to favor Germany and Netherlands in Europe. India, Japan, and China in Asia, along with Brazil and Mexico in Central & South America. Across sectors, we favor consumer discretionary companies exposed to the strong middle-class growth seen in specific emerging countries.
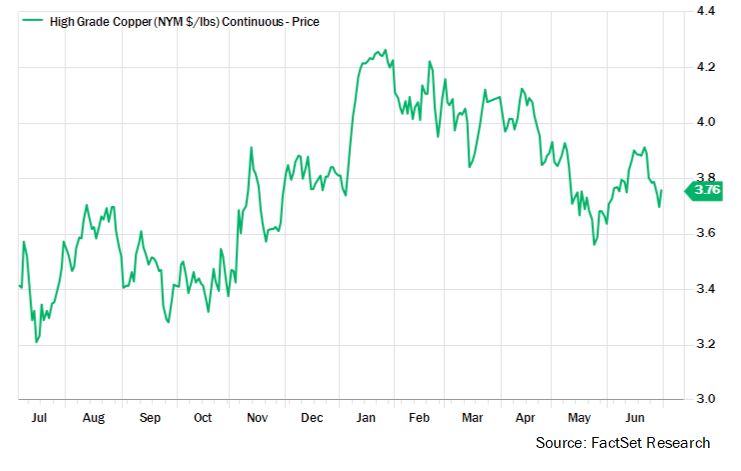
Shifting to natural resources, after a three-year run of overweight positioning that moved to neutral mid-2022 through a sale of soft commodities and natural gas, we moved underweight earlier this year by reducing copper exposure. The weakening of inflation has caused the asset class to fall about 9% in 2023. Many of the previously tenuous supply issues have reversed as economic growth has slowed. The charts below show examples of our portfolio sales.
Copper peaked in January after a strong move from summer 2022.
Soybeans and corn reached cycle highs in early summer 2022 and late 2022.

In the real estate asset class, spiking interest rates have been a major headwind for REITs. Domestic REITs peaked a few months prior to the start of the Fed hiking cycle (red line) and are now 30% off their pre-hiking high.
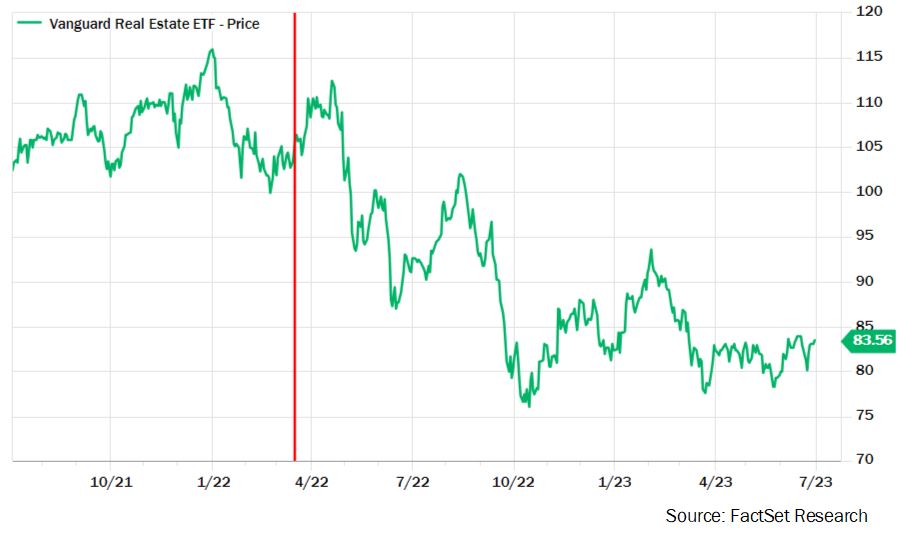
Unfortunately, REITs had generally high valuations and lower yields entering the Fed’s interest rate hiking cycle. Domestic REITs were trading at a P/E of over 20x, while barely yielding 2.5% before the Fed started tightening.

We continue to believe that at an asset class level, the reward-to-risk for REITs does not provide a sufficient relative yield with an appropriately low valuation profile to broadly increase our exposure.
Our real estate asset class universe includes commercial real estate exposure, via REITs and service companies, and residential exposure, mainly via homebuilders. The commercial real estate exposure is increasingly in select REIT situations and services instead of solely in broad REIT exposure. On the residential side, we have zero exposure for the first time in three years after eliminating our exposure late in the second quarter.

The Investment Team uses the alternative investments asset class to hedge segments of the portfolio or for appreciation by owning sub-asset classes like private equity or distressed companies. In late 2022, we began to shift the asset class from mostly hedging, toward an appreciation bias. On the hedging side, we unwound our interest rate hedge which benefitted from rising rates and reduced the long U.S. dollar exposure. We later used the proceeds to build positions in publicly traded private equity companies that we feel will have ample future opportunities to purchase distressed assets and distressed debt at inexpensive multiples.
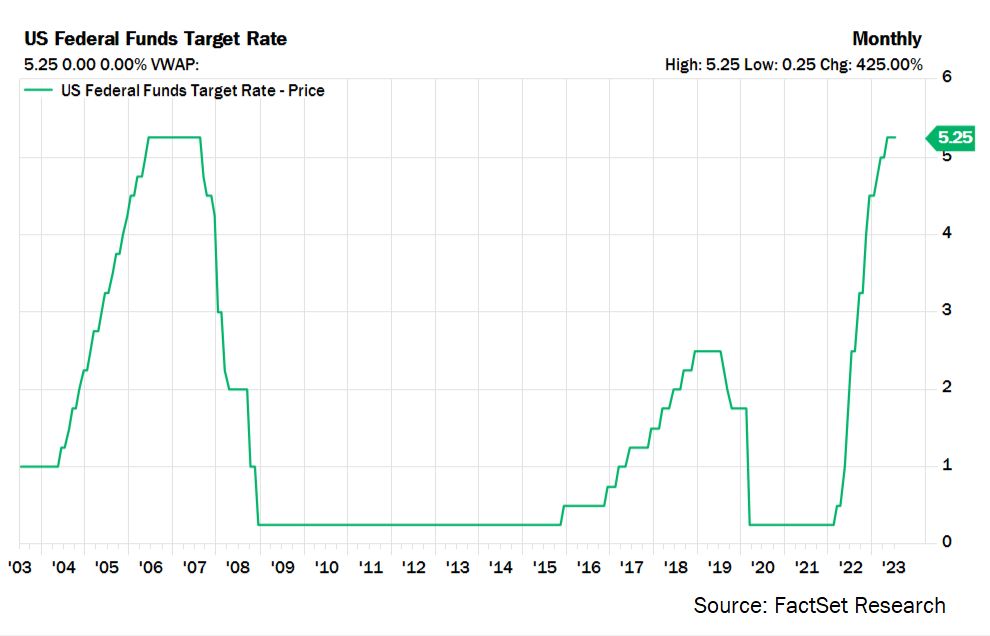
Finally, in the fixed income asset class, we shifted to an overweight position in 2023 for the first time in nearly 15 years. We are purchasing high quality investment grade corporate and municipal bonds and are slowly lengthening maturities as the Federal Reserve approaches the end of the tightening cycle.
The chart shows the present Fed Funds target rate now matches the 2006/2007 high.
We are pleased that the fixed income asset class has, once again, become more compelling after a long hiatus. This asset class will be a meaningful generator of portfolio yield, income, and lower risk returns that will contribute to a portfolio’s total return while reducing risk. We have been methodical in managing this asset class and will continue to do so as we push maturities out while buying high quality bonds.
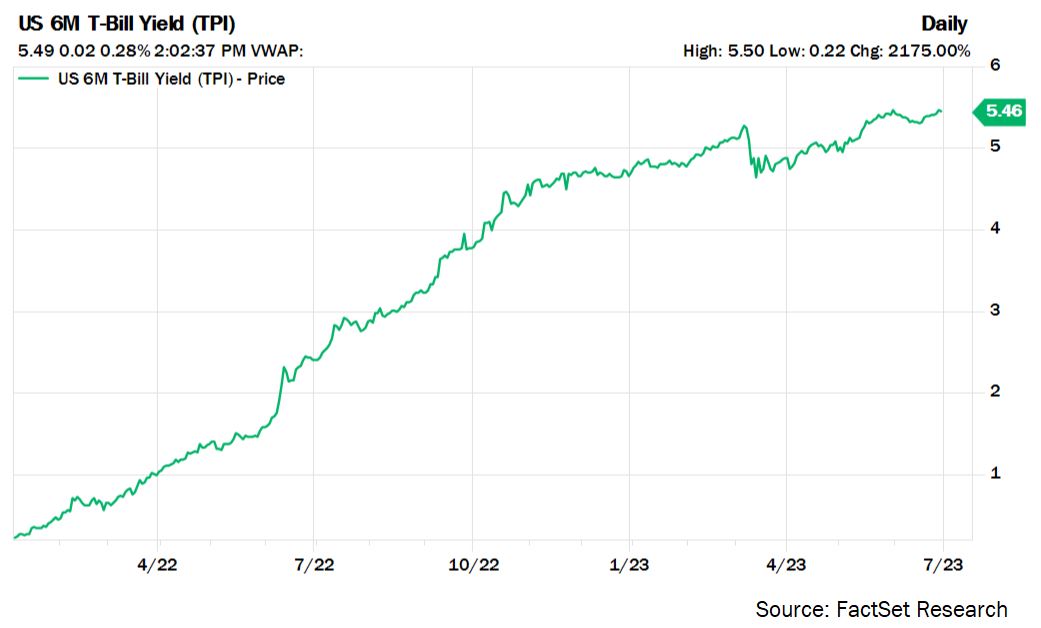
We are also taking advantage of high short-term interest rates by investing excess cash from recent domestic equities sales into safe, short-term securities yielding around 5%.
6-month U.S. T-Bills yielded nearly 0% entering 2022. They now yield nearly 5.5%.
For the past ten years or so, markets, styles, and asset classes have been fluid, cycling in and out of favor based on volatile macro-economic variables caused by everything from a credit crisis, to a debt crisis, to a trade war, to a global pandemic. As these styles and asset classes continue to experience higher volatility, we believe our style-agnostic discipline and strict adherence to buying the best investments at appropriately high reward-to-risk ratios will enable the Investment Team to continue to deliver returns without subjecting you to high risk. We look forward to seeing what asset classes have in store for us in the second half of 2023.