In the first quarter Wealth Report, we discussed how the outbreak of war in Iran and closure of the Strait of Hormuz upended the rate-cut narrative and sent Treasury yields higher. Over the subsequent three months, we endured a very memorable quarter, marked by a highly dynamic interest rate and energy environment, while elsewhere in global markets the returns to semiconductor stocks were spectacular. The diverging fortunes of these distinct yet interrelated corners of the market were something to behold. On the interest rate and energy side, it was marked by two main phases. First, there was escalation: Brent crude oil climbed to a wartime high of ~$130 per barrel in late April as tanker traffic through the strait fell to effectively zero. Long-term interest rates moved sharply higher in tandem. Then, there was de-escalation: on June 17th, the US and Iran signed a memorandum of understanding launching a 60-day negotiation window, and the strait began to reopen. By quarter end, Brent had round-tripped all the way back to the low $70s, roughly its pre-war level. Treasury yields, however, declined to make the return journey. The 10-year Treasury yield ended the quarter at ~4.50%, over 0.50% higher than the pre-war level. The message from the bond market was two-fold: war spending (in the context of an already large US budget deficit) and geopolitical risk remain elevated, and the energy shock will take time to fully pass through to inflation, both conspiring to keep yields elevated.
As the energy price shock works its way through the system, against the backdrop of higher-than-expected inflation data year-to-date, the “hawks” within the Federal Reserve are ascendant. Hawk in this context means preferring higher interest rates to more aggressively combat inflation. This is a notable shift in policy stance from the Fed, which under former Chair Powell had generally taken a more dovish stance (preferring to “look through” temporary inflation and thus keep interest rates lower all else equal). So, today, as the US labor market remains broadly solid while inflation data prints higher than expected, what is the Fed to do? In this moment, the hawks ‘find their wings’. As shown in the June Dot Plot, the latest projections show at best no change to the Fed’s policy rate in 2026, and at worst a rate hike. This is driven in large part by Headline CPI inflation reaching 4.2% in May, the highest reading since May 2023. As if the current environment wasn’t dynamic enough, into the Fed Chairmanship comes Kevin Warsh. His debut at the June FOMC meeting was on brand: the post-meeting prepared statement was cut to roughly 130 words, about two-thirds shorter than April’s, with the prior easing bias removed entirely and replaced by a single declarative promise: “The Committee will deliver price stability.” Rates were held at 3.50%–3.75% by unanimous vote, but the tone had unmistakably shifted.
2026 Year-to-Date Performance
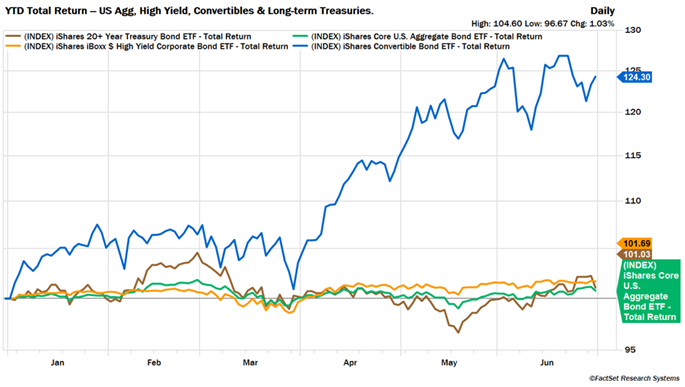
Through the first half of the year, fixed income total returns remain positive but muted as declines in bond prices are largely offset by strong starting yields. Leading the market are convertible bonds (linked to equity markets making all-time highs), while longer-duration bonds are lagging.
Other Items of Interest
June FOMC Dot Plot
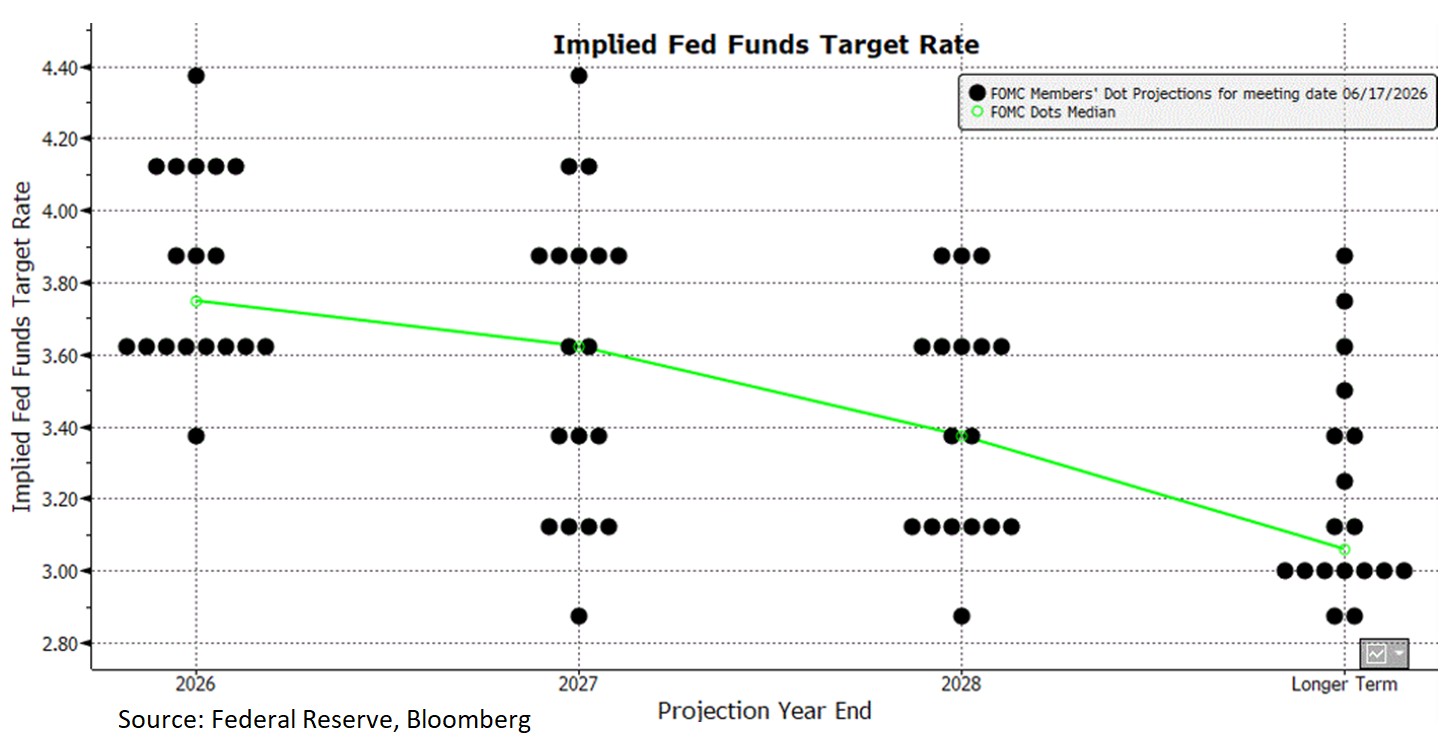
The June Dot Plot displays a clear policy stance shift. For the first time this cycle, the median Fed Funds rate projection implies a rate hike by year end. The 2026 median jumped to 3.8% from 3.4% in March, erasing the one cut previously penciled in. Breaking down the Dot Plot further, of the 18 participants who submitted projections, nine see at least one hike this year (six of whom see two or more), eight see no change, and one member still sees a cut. Something else that stuck out – there were only 18 dots. New Chair Warsh declined to submit his own projection, “consistent with my long-held views.” It may be fair to say this is the most divided the Committee has been in years. The main driver of the hawkish Dot Plot is the inflation forecast, which was revised higher to 3.6% for Headline PCE inflation and 3.3% for Core inflation, both of which are up from 2.7% in March.
A final note: Please take a moment of silence for what may be both the first and last Dot Plot of the Warsh era, a casualty of a fundamental difference in communication preferences.
Federal Funds Rate Futures Pricing
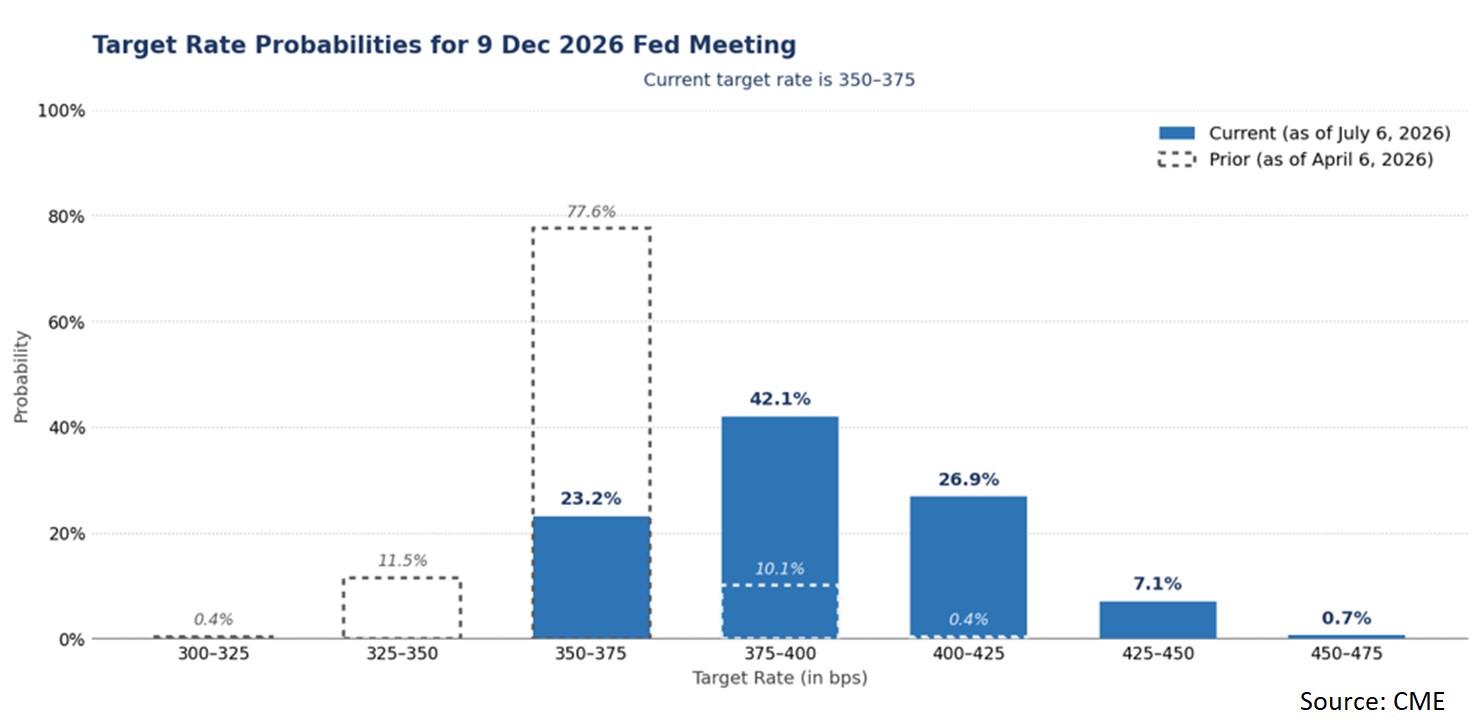
Three months ago, we noted the market had implied a roughly 10% probability of a rate hike by year end. What a difference a quarter makes. Following recently elevated inflation data and the hawkish June meeting (Warsh’s first), the market fully embraced the hiking narrative. At present, futures markets are positioned for a “coin flip” at the September meeting. The soft June jobs report pared the likelihood, but odds remain roughly 50/50 for a hike in September. Absent a hike by September, then both remaining meetings (October and December) will likely remain coin flips. The ongoing push and pull between the inflation and employment data will ultimately drive the outcome.