
When the first half of 2017 closed, energy equities had registered their weakest relative first half performance versus the S&P 500 on record. In June, energy as a percentage of the S&P 500 hit the lowest level since 2001. An examination of some of the key drivers of the recent roller coaster moves in energy, plus OPCM’s energy investing strategy follows.
The Oil Supply Roller Coaster
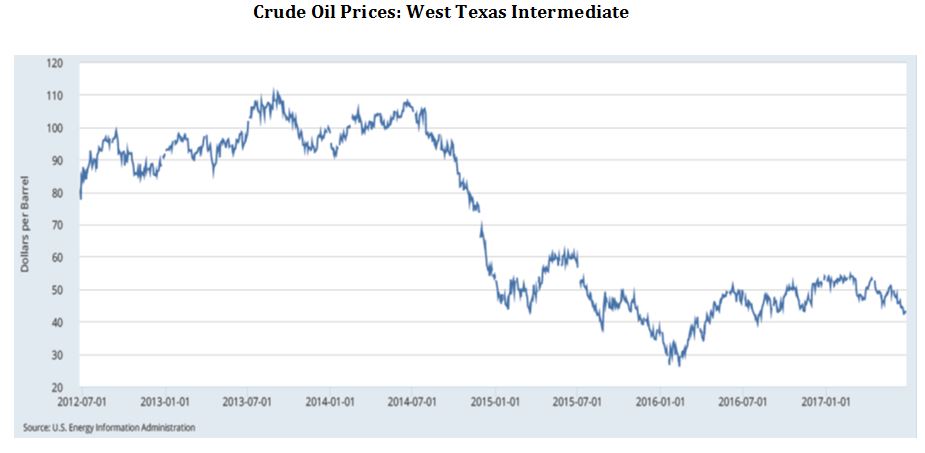
Supply remains the key variable for oil prices. Empowered by sustained oil prices of $80 to $110 from 2010 through 2014, energy producers increased global investment by over 50%. Supply surprised to the upside, contributing to oil’s slide to the $20s in 2016. Oil prices corrected faster than service costs and extraction efficiency improved, driving an over 50% cut to global investment by producers from 2014 through 2016. The US oil rig count fell from over 1,600 to 316. This contributed to a stretch in 2015 and 2016 where month-over-month oil output growth by US shale producers fell 17 out of 21 months. Lower investment compelled service companies to slash prices, in many cases by 40% or more from 2014 through 2016. The pain of lower oil prices incentivized producers to adopt more efficient extraction techniques, driving annual double-digit efficiency gains the last couple of years. Taken together, lower service cost and more cost efficient extraction techniques yielded a lower oil price that producers needed to make money (i.e., breakeven), in some regions by over 60% versus 2013 breakeven prices.
Emboldened by (a) the lower breakeven price; (b) OPEC (a group of 14 oil-producing nations that implement common production policies) and some non-OPEC nations cutting output in late 2016 for the first time in 8 years; (c) oil prices stabilizing between $40 and the low-$50s; (d) easier financing conditions for lower quality producers; and (e) oil futures strength as the number of long oil futures contracts rose by four times from early 2016 through early 2017, US producers ramped investment in mid-2016 into 2017. US oil rigs went from a 316 low to over 700, after a record 31 consecutive weeks of increases.
This investment and well productivity that has more than doubled in many regions, among other factors, renewed investor worry about oversupply in the oil market. Expressing this concern, speculator oil futures short interest (betting on a decline in oil) went from a 6-year low at the start of 2017 to a record high in late June, oil fell roughly 15% in the first half of 2017, and energy equities underperformed the S&P 500 by over 20%.
The Case for Energy
Naturally, the historic energy weakness triggers the question, “Why bother investing in energy?”
First, over the past 20-plus years, energy’s relative performance has exhibited a multi-year reversion pattern where multi-year underperformance has often preceded multi-year outperformance. History does not always repeat, but the pattern makes sense. Low oil prices instill producer discipline. In June at an energy conference, low-cost producers said they would start to slow investment if oil stayed in the $40 to $45 range. The dramatic cuts in investment in 2015 and 2016 will impact overall production in 18 to 24 months, while production from peak investment periods 2013 and 2014 are estimated to top off in 2017 and decline going forward. Energy credit spreads, an indicator of default risk, are beginning to widen from multi-year lows. Too aggressive investment drives up service cost inflation, which is starting to be seen now with well productivity in the prolific Permian Basin in West Texas beginning to decelerate. The reversion pattern is volatile coming out of a bear market, as seen in the late 1980s, but opportunities to potentially outperform over a multi-year period can present themselves.
Second, energy provides a natural hedge against a few different risk factors within portfolios. Over time, energy has moved inversely to unexpected inflation and US dollar weakness.
Third, energy can offer opportunities with uniquely attractive risk-reward profiles that are not 100% tied to the price of oil. Also, when a broad category like energy is beaten down, quality differentiation can get lost, as strong and weak companies get punished, enabling investment in assets with strong longer term prospects at compelling values.
Portfolio Strategy

Within natural resources, asset selection within a diversified basket of assets across energy, timber, water, and metals has helped the asset class withstand a prolonged bear market. Within energy, the focus has been on natural gas producers and energy infrastructure. For natural gas producers, the unique opportunities are: (a) introduction of pipelines in the Northeast region to remove excess supply to improve pricing; and (b) natural gas producers being further along the path to disciplined production than oil producers. For energy infrastructure, the unique opportunities are: (a) benefiting from the need for pipeline, gathering, processing infrastructure to handle the increased US energy supply; and (b) being an income-generating asset that is not valued at historic extremes like other relatively high dividend assets.
Within domestic equity, energy investments have avoided companies whose sole focus is producing oil. Instead, energy investments have overweighted companies that over the short term benefit from higher domestic oil and natural gas supply, while benefiting from business transformation efforts over the longer term.
Going forward, assets that could benefit from a potential broader energy multi-year reversion pattern, have relatively higher quality businesses, and offer uniquely attractive risk-reward opportunities will remain the focus of the OPCM Investment Team’s energy investing. At this point in the volatile energy cycle, it may include incremental allocation towards companies that benefit from oil production.